Graphing Distance and Time
Provided by: PBS|Published on: June 25, 2024
Grades: 3, 4, 5, 6, 7, 8
Type: Lesson Plans
Subjects: Mathematics
Authors: PBS
Region: Global
Languages: English

This resource has been reviewed by SubjectToClimate's climate scientists and verified for scientific accuracy and up-to-date information. Learn about our review process →
This resource has been reviewed by SubjectToClimate's climate scientists and verified for scientific accuracy and up-to-date information. Learn about our review process →
Synopsis
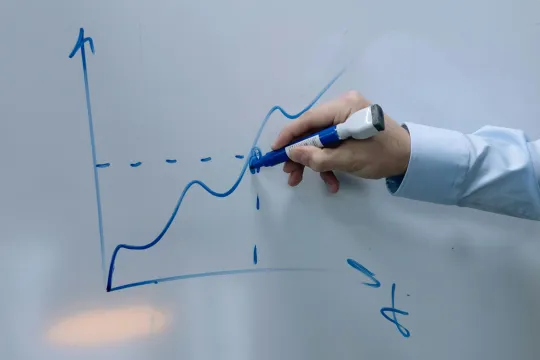
- In this interactive course, students will learn about distance-time graphs, how to interpret them, and the vocabulary used in reading graphs.
- This lesson also includes videos and exercises on distance-time graphs to help students better understand this lesson.
Teaching Materials
Positives
- At the end of the resource, students are provided with feedback and grades for their attempted exercises.
- This resource contains different learning models like videos and interactive graphing activities catering to different learning styles.
- This student-led activity is great for virtual learning days or an easy substitute plan.
Prerequisites
- Students will need to create an account before accessing this resource.
- Students need basic familiarity with concepts of speed, time, distance, and how they relate to each other.
- To keep track of students' progress, answers, and understanding, teachers may want to require students to print or save their work upon completion.
- The PDFs for the reading "Ahead or Behind?" and the final assignment may not open. If this happens, students can skip the question about the reading and complete the final assignment using the on-screen directions and the writing prompts on the page with the rubric in the Teacher's Guide (LINK).
- The link for Teaching Matters is broken, but teachers can find the homepage by clicking HERE.
Differentiation & Implementation
- Students can identify different transportation alternatives that don't affect the climate or have less impact, like riding a bike, taking a walk, or using public transport.
- As homework, students can time their journey from one part of the school to another or from school to home, then create a graph to compare the speed of two different journeys.
- Older students can calculate the acceleration of the individuals at different times.
- Teachers can use the terms from the glossary to create a word wall for students to reference.
- This activity is geared towards 5-8 grade students. Younger students may be able to complete the activity as a class with teacher guidance.
This interactive resource guides students in understanding distance-time graphs. All of the text is clear, and numerous interactive exercises provide good opportunities for assessment. Terms are defined clearly, but one issue is that the resource insists on using the term ‘steepness’ rather than ‘slope’ to refer to the rate of change. This resource is recommended for teaching.
Teaching Tips
Standards
Resource Type and Format
Scientist Reviewed
This resource has been reviewed by SubjectToClimate's climate scientists and verified for scientific accuracy and up-to-date information. Our review process ensures that every resource in our library reflects the current state of climate science.
Learn about our review process →