New Jersey Flood Mapper
Provided by: Rutgers University|Published on: April 27, 2021
Grades: 6, 7, 8, 9, 10, 11, 12
Type: Data, Graphs, and Maps
Subjects: Social Studies, Earth and Space Sciences, Engineering
Authors: Rutgers University
Region: New Jersey
Languages: English

This resource has been reviewed by SubjectToClimate's climate scientists and verified for scientific accuracy and up-to-date information. Learn about our review process →
This resource has been reviewed by SubjectToClimate's climate scientists and verified for scientific accuracy and up-to-date information. Learn about our review process →
Synopsis
- This interactive flood mapping tool shows which parts of New Jersey will be prone to future flooding based on three greenhouse gas emissions scenarios and various factors that can be adjusted.
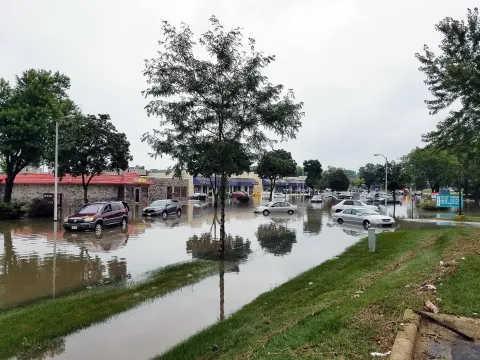
- Other helpful features include a tool called "municipal snapshots," which allows students to build a variety of reports on a chosen municipality, and "New Jersey MyCoast," which displays photos of actual flood events on the map.
Teaching Materials
Positives
- This tool gives students a visual representation of how greenhouse gas emission levels will directly affect the rate of flooding in New Jersey.
- Students can share, save, or print maps.
Prerequisites
- Students should start by clicking on the "total water levels tool," which will help them to understand the different data points.
- The term "SLOSH" stands for sea, lake, and overland surges from hurricanes.
Differentiation & Implementation
- Science teachers could assign students different locations and scenarios and have them write a report showing what the location will look like in fifty years.
- Social studies and civics classes could use the "map layers" section of the resource to introduce a variety of pertinent layers into the map.
- Other resources on this topic include this interactive Google Earth resource on the fate of coastal cities and this podcast episode on sea level rise.
This map features data layers on flood hazards, social vulnerability, land-use and land-cover change, infrastructure, transportation, marsh, and open space in New Jersey. Students can navigate to gain insights on potential environmental hazards, the current level of social vulnerability, etc. Although the map contains some limitations, for instance, it does not include datasets on wind-driven tides and coastal erosion, it is an interactive and engaging tool and it's recommended for teaching.
Teaching Tips
Standards
Resource Type and Format
Scientist Reviewed
This resource has been reviewed by SubjectToClimate's climate scientists and verified for scientific accuracy and up-to-date information. Our review process ensures that every resource in our library reflects the current state of climate science.
Learn about our review process →